23:10:41 21/6/2025 - 17 lượt xem
XDebug + Docker + Laravel + WSL + VS Code
- This post will help you configure XDebug to work with WSL, Docker, VS Code (Cursor, Windsuft).
- In my way, I will install and configure Xdebug directly inside the container.
- I suppose I built the image done and my Laravel project service is named primass_server
Install Xdebug
- Access WSL Terminal
- Access to the container
docker compse exec primass_server bash- Install Xdebug
dnf install -y php-xdebug- Verify that the installation is successful
php -vExpect the output: with Xdebug v3.x.x
docker-php.ini
Create a file docker-php.ini
Create a docker-php.ini file, in the container:
nano /etc/php.d/xdebug.iniPaste this content:
zend_extension=xdebug.so
xdebug.mode=develop,debug
xdebug.start_with_request=yes
xdebug.discover_client_host=0
xdebug.client_host=172.18.0.1
xdebug.client_port=9003The importance of this file is that you need to set the IP of the container for xdebug.client_host.
To find your IP of container you need to run the command:
dnf install -y iprouteip route | grep defaultFor example, my output is:
default via 172.18.0.1 dev eth0Set client_host with the IP you found.
Apply the configuration
Run these commands to apply, because my service uses php-fpm, so I run
systemctl restart php-fpm
systemctl restart httpd
VS Code
Verify the XDebug configuration is working
- In PHP, you put this code to display the information of XDebug
echo xdebug_info();The output should be
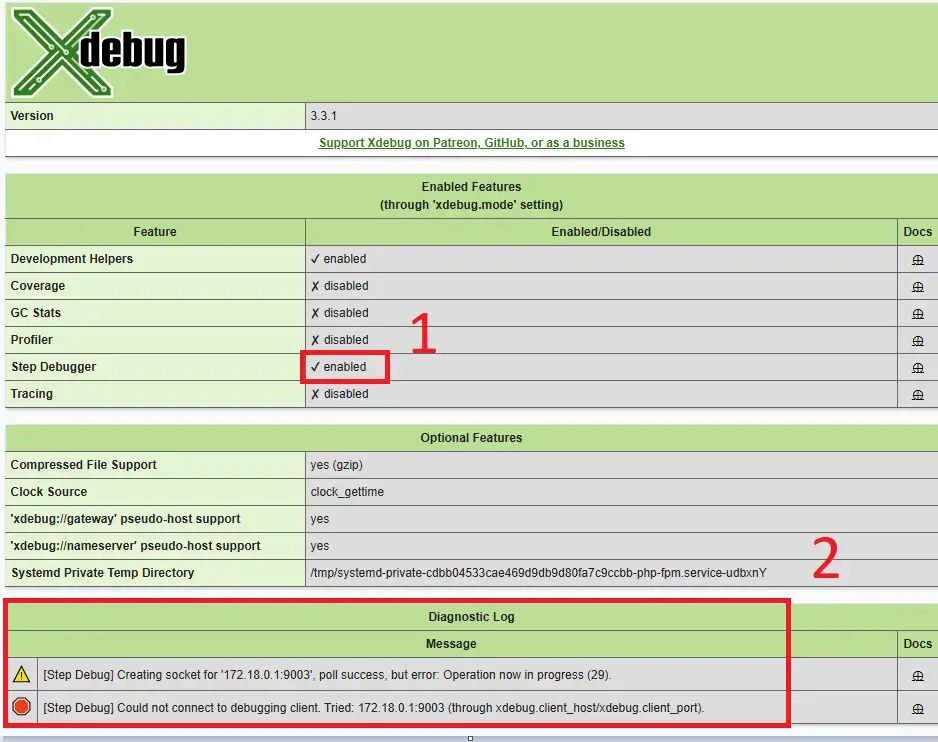
(1) - This is important, it helps you when you put the breakpoint to debug
(2) - This message logs tell that in the container is waiting the VS Code to connect to it
To fix (2), we will come to the next step.
Create launch.json for VS Code to connect with the container
- Install the extension named "PHP Debug"
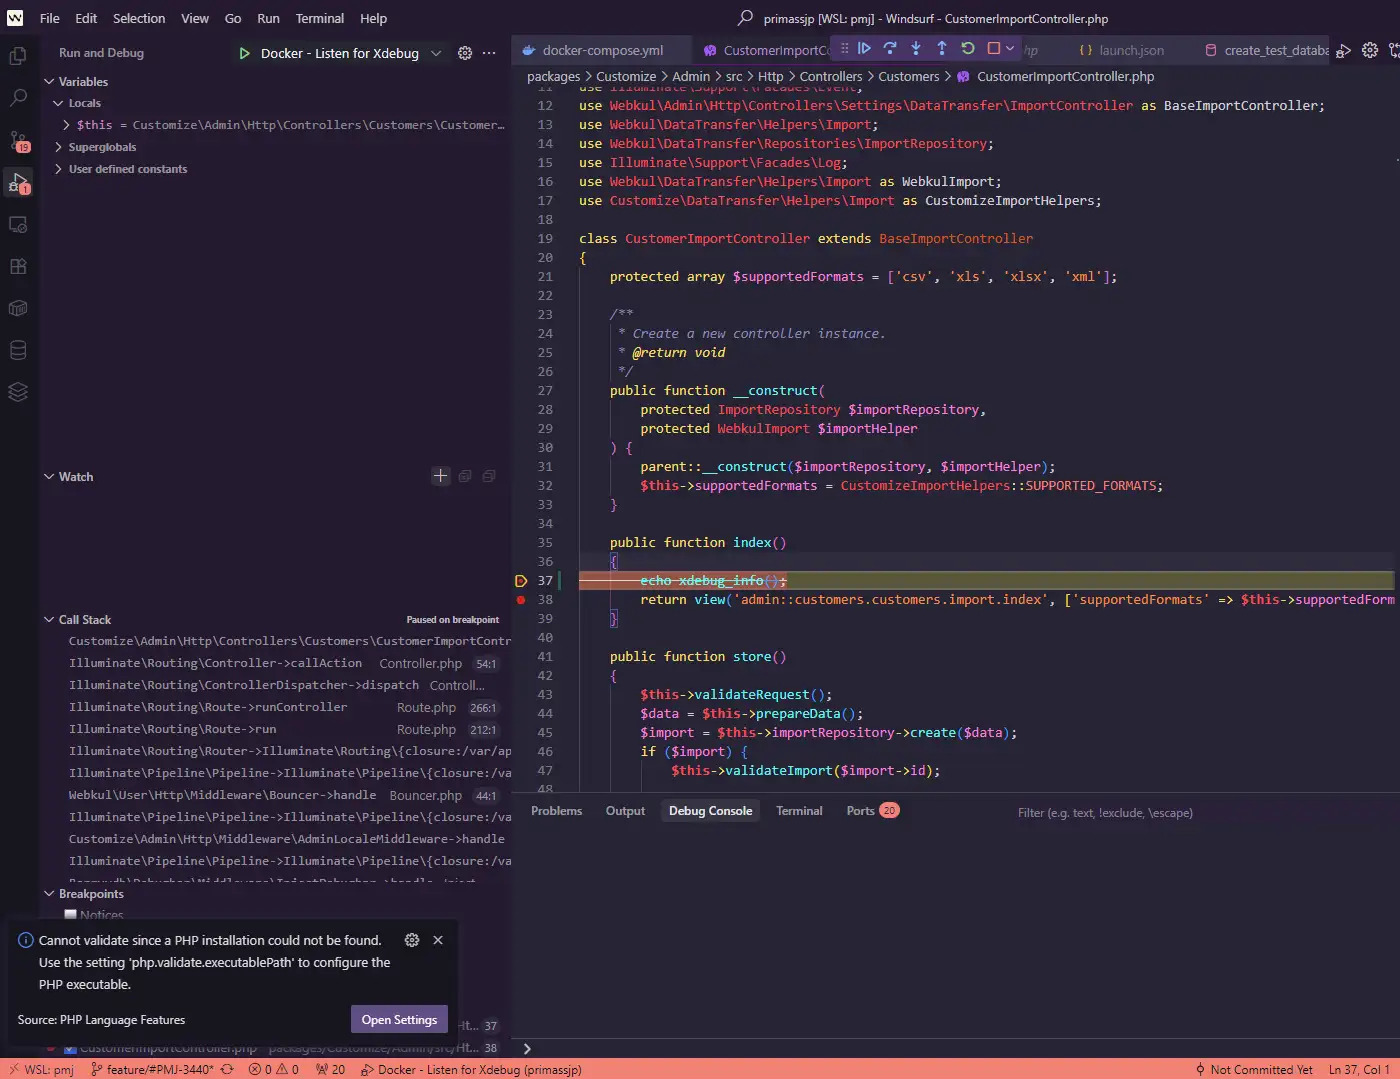
- Switch to Run and Debug tab (Ctrl + Shift + D)
- Click Create launch.json and add an object
{
"version": "0.2.0",
"configurations": [
{
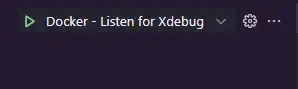
"name": "Docker - Listen for Xdebug",
"type": "php",
"request": "launch",
"port": 9003,
"hostname": "172.18.0.1",
"pathMappings": {
"/var/app/primass": "${workspaceFolder}"
}
},
...
}The two important points in this file are:
"hostname": "172.18.0.1"
This is the IP of the container. I found it in the before step
"/var/app/primass": "${workspaceFolder}"
You must set exactly the path, in my case is /var/app/primass, because in docker-compose.yml, I mount my project source code like this:
services:
  primass-server:
	volumes:
	      - "./:/var/app/primass"
- Click the Run icon to enable Debug
Now, you refresh the browser, and you will see the result like this
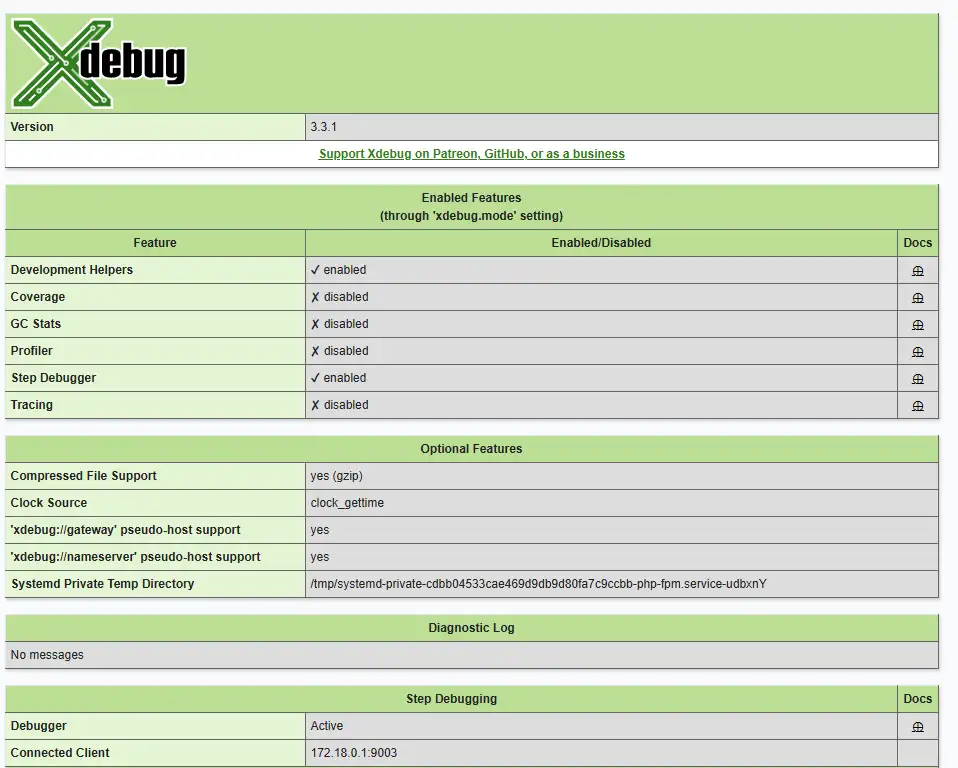
Now, you can put the breakpoint in your code and enjoy the result. In my case, the breakpoint is hit